
Define alerts
In the repository are three alerts configuration files:
- Monitoring services alerts targets.rules
- Docker Host alerts hosts.rules
- Docker Containers alerts containers.rules
You can modify the alert rules and reload them by making a HTTP POST call to Prometheus:
curl -X POST http://<host-ip>:9090/-/reload
Monitoring services alerts
Trigger an alert if any of the monitoring targets (node-exporter and cAdvisor) are down for more than 30 seconds:
ALERT monitor_service_down
  IF up == 0
  FOR 30s
  LABELS { severity = "critical" }
  ANNOTATIONS {
      summary = "Monitor service non-operational",
      description = "{{ $labels.instance }} service is down.",
  }
Docker Host alerts
Trigger an alert if the Docker host CPU is under hight load for more than 30 seconds:
ALERT high_cpu_load
  IF node_load1 > 1.5
  FOR 30s
  LABELS { severity = "warning" }
  ANNOTATIONS {
      summary = "Server under high load",
      description = "Docker host is under high load, the avg load 1m is at {{ $value}}. Reported by instance {{ $labels.instance }} of job {{ $labels.job }}.",
  }
Modify the load threshold based on your CPU cores.
Trigger an alert if the Docker host memory is almost full:
ALERT high_memory_load
  IF (sum(node_memory_MemTotal) - sum(node_memory_MemFree + node_memory_Buffers + node_memory_Cached) ) / sum(node_memory_MemTotal) * 100 > 85
  FOR 30s
  LABELS { severity = "warning" }
  ANNOTATIONS {
      summary = "Server memory is almost full",
      description = "Docker host memory usage is {{ humanize $value}}%. Reported by instance {{ $labels.instance }} of job {{ $labels.job }}.",
  }
Trigger an alert if the Docker host storage is almost full:
ALERT hight_storage_load
  IF (node_filesystem_size{fstype="aufs"} - node_filesystem_free{fstype="aufs"}) / node_filesystem_size{fstype="aufs"}  * 100 > 85
  FOR 30s
  LABELS { severity = "warning" }
  ANNOTATIONS {
      summary = "Server storage is almost full",
      description = "Docker host storage usage is {{ humanize $value}}%. Reported by instance {{ $labels.instance }} of job {{ $labels.job }}.",
  }
Docker Containers alerts
Trigger an alert if an example Jenkins container is down for more than 30 seconds:
ALERT jenkins_down
  IF absent(container_memory_usage_bytes{name="jenkins"})
  FOR 30s
  LABELS { severity = "critical" }
  ANNOTATIONS {
    summary= "Jenkins down",
    description= "Jenkins container is down for more than 30 seconds."
  }
Trigger an alert if the container is using more than 10% of total CPU cores for more than 30 seconds:
 ALERT jenkins_high_cpu
  IF sum(rate(container_cpu_usage_seconds_total{name="jenkins"}[1m])) / count(node_cpu{mode="system"}) * 100 > 10
  FOR 30s
  LABELS { severity = "warning" }
  ANNOTATIONS {
    summary= "Jenkins high CPU usage",
    description= "Jenkins CPU usage is {{ humanize $value}}%."
  }
Trigger an alert if the container is using more than 1,2GB of RAM for more than 30 seconds:
ALERT jenkins_high_memory
  IF sum(container_memory_usage_bytes{name="jenkins"}) > 1200000000
  FOR 30s
  LABELS { severity = "warning" }
  ANNOTATIONS {
      summary = "Jenkins high memory usage",
      description = "Jenkins memory consumption is at {{ humanize $value}}.",
  }
Setup alerting
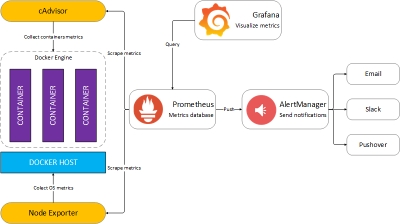
The AlertManager service is responsible for handling alerts sent by Prometheus server. AlertManager can send notifications via email, Pushover, Slack, HipChat or any other system that exposes a webhook interface. A complete list of integrations can be found here.
You can view and silence notifications by accessing http://<host-ip>:9093.
The notification receivers can be configured in alertmanager/config.yml file.
To receive alerts via email you need delete the default SLACK channel and add route and receiver substituting your values
route:
group_by: [Alertname]
# Send all notifications to me.
receiver: email-me
receivers:
- name: email-me
email_configs:
- to: This email address is being protected from spambots. You need JavaScript enabled to view it.
from: This email address is being protected from spambots. You need JavaScript enabled to view it.
smarthost: smtp.myemailaddress.com:587 # or your email server port
auth_username: "emailaccountusername"
auth_password: "emailaccountpasword"
smtp_require_tls: TRUE # or FALSE
Extending the monitoring system
Dockprom Grafana dashboards can be easily extended to cover more then one Docker host. In order to monitor more hosts, all you need to do is to deploy a node-exporter and a cAdvisor container on each host and point the Prometheus server to scrape those.
You should run a Prometheus stack per data center/zone and use the federation feature to aggregate all metrics in a dedicated Prometheus instance that will serve as an overview of your whole infrastructure. This way, if a zone goes down or the Prometheus instance that does the zones aggregation goes down, your monitoring system present on the remaining zones can still be accessed.
You can also make Prometheus highly available by running two identical Prometheus servers in each zone. Having multiple servers pushing alerts to the same Alertmanager will not result in duplicate alerts, since Alertmanager does deduplication.