
Getting started with Prometheus and Docker
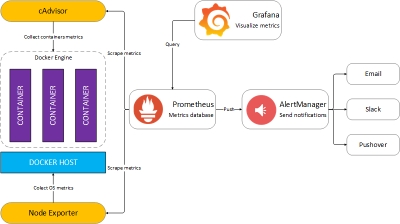
To try out the Prometheus stack, I used the dockprom repository on GitHub. You can use dockprom as a starting point in developing your own monitoring solution. With dockprom you can, run with one command, the whole stack: Prometheus, Grafana, cAdvisor, NodeExporter and AlertManager.

Install
Clone dockprom repository on your Docker host, cd into dockprom directory and run compose up:
$ git clone https://github.com/stefanprodan/dockprom
$ cd dockprom
$ docker-compose up -d
Containers:
- Prometheus (metrics database)
http://<host-ip>:9090 - AlertManager (alerts management)
http://<host-ip>:9093 - Grafana (visualize metrics)
http://<host-ip>:3000 - NodeExporter (host metrics collector)
- cAdvisor (containers metrics collector)
While Grafana supports authentication, the Prometheus and AlertManager services have no such feature. You can remove the ports mapping from the docker-compose file and use NGINX as a reverse proxy providing basic authentication for Prometheus and AlertManager (see this excellent container).
Setup Grafana
Navigate to http://<host-ip>:3000 and login with user admin password changeme. You can change the password from Grafana UI or by modifying the user.config file.
From the Grafana menu, choose Data Sources and click on Add Data Source. Use the following values to add the Prometheus container as data source:
- Name: Prometheus
- Type: Prometheus
- Url: http://prometheus:9090
- Access: proxy
Now you can import the dashboard temples from the grafana directory. From the Grafana menu, choose Dashboards and click on Import.
Docker Host Dashboard
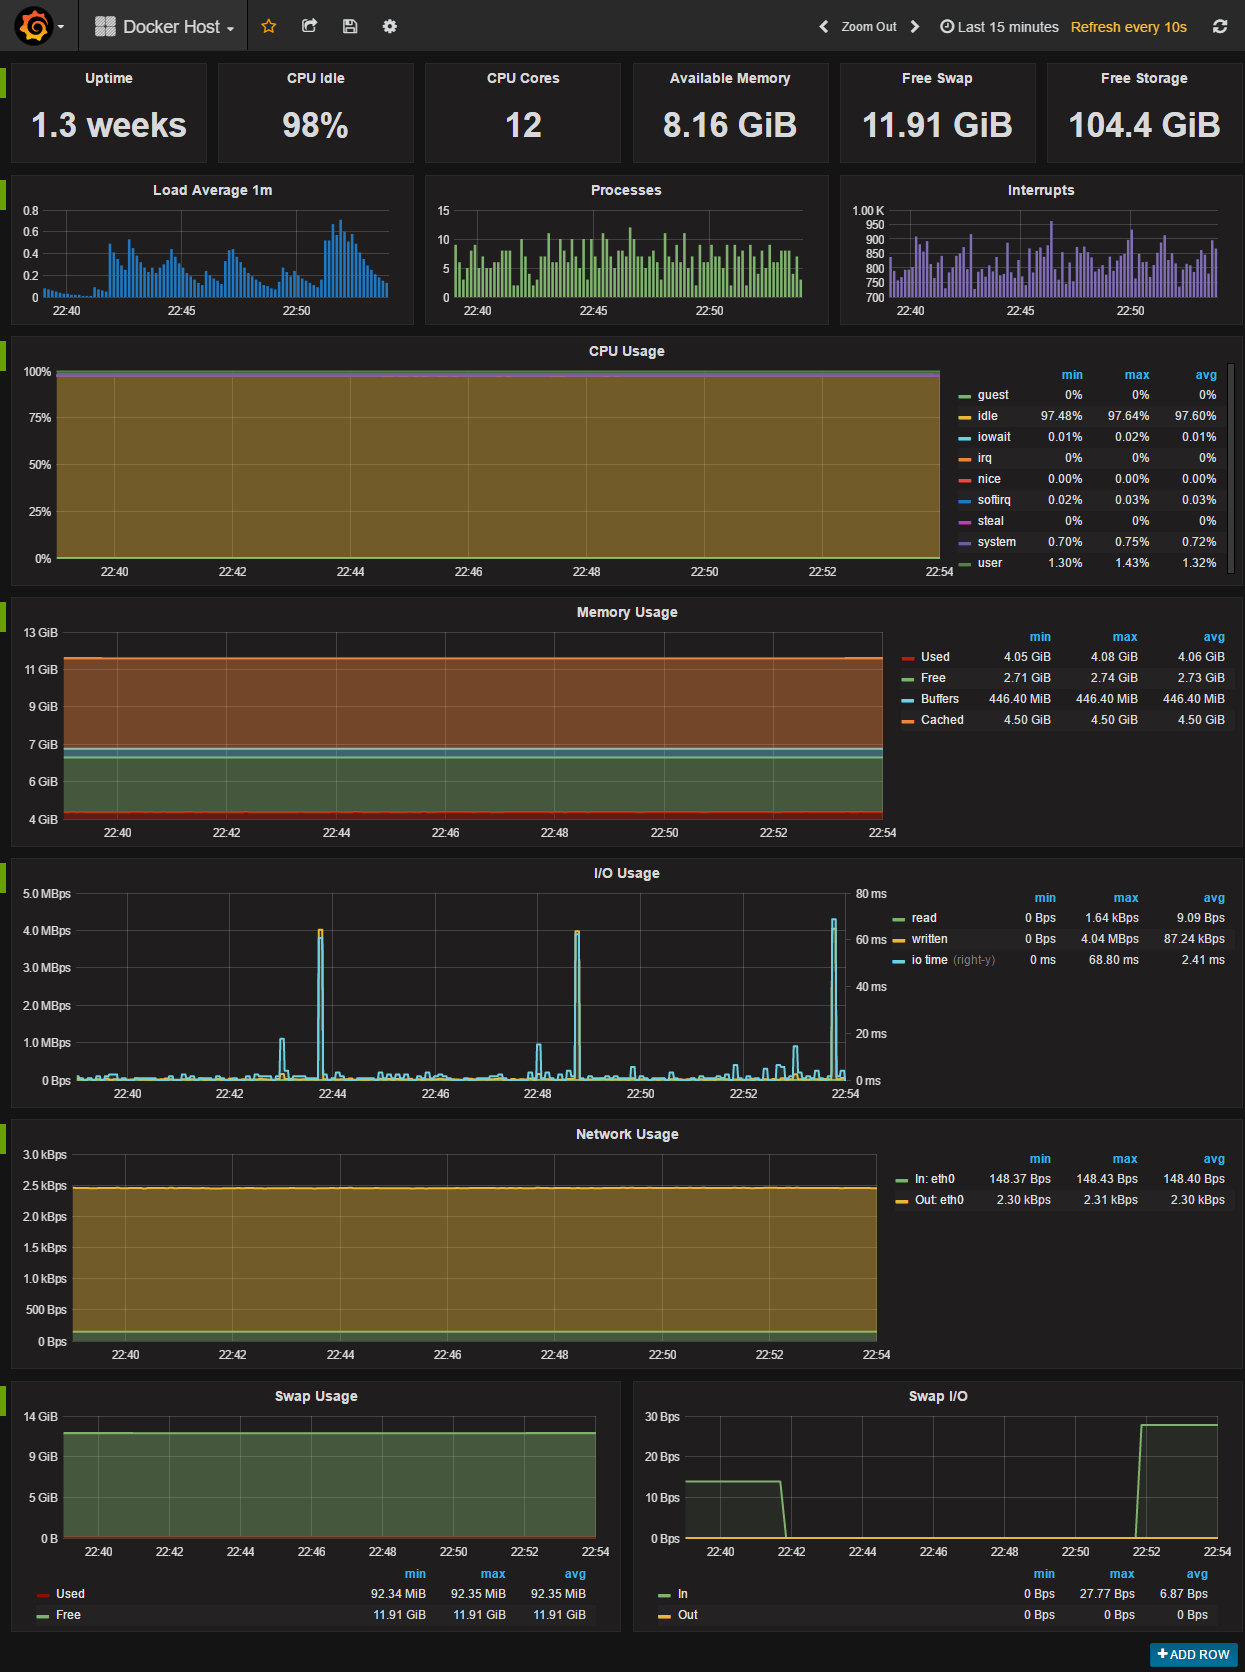
The Docker Host Dashboard shows key metrics for monitoring the resource usage of your server:
- Server uptime, CPU idle percent, number of CPU cores, available memory, swap and storage
- System load average graph, running and blocked by IO processes graph, interrupts graph
- CPU usage graph by mode (guest, idle, iowait, irq, nice, softirq, steal, system, user)
- Memory usage graph by distribution (used, free, buffers, cached)
- IO usage graph (read Bps, read Bps and IO time)
- Network usage graph by device (inbound Bps, Outbound Bps)
- Swap usage and activity graphs
Docker Containers Dashboard
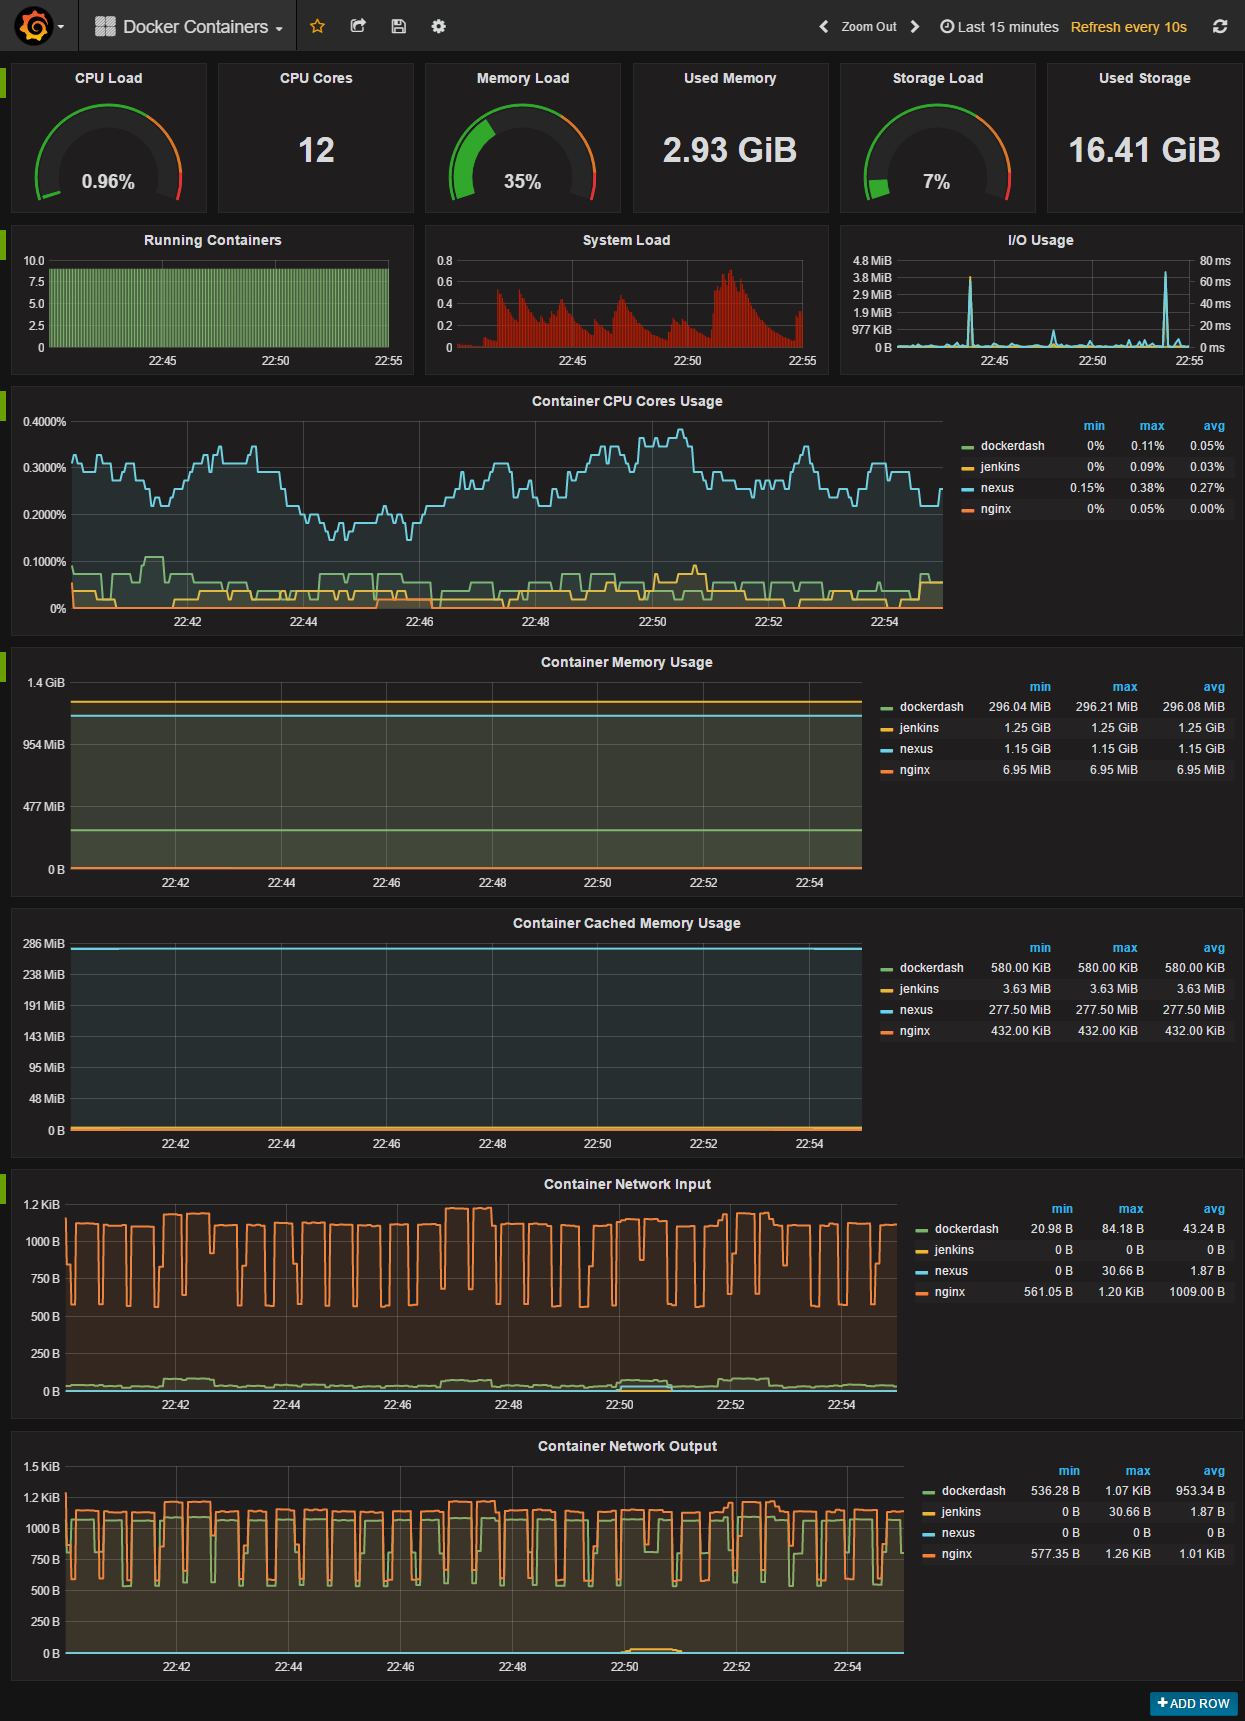
The Docker Containers Dashboard shows key metrics for monitoring running containers:
- Total containers CPU load, memory and storage usage
- Running containers graph, system load graph, IO usage graph
- Container CPU usage graph
- Container memory usage graph
- Container cached memory usage graph
- Container network inbound usage graph
- Container network outbound usage graph
Note : this dashboard doesn’t show the containers that are part of the monitoring stack.
Monitor Services Dashboard
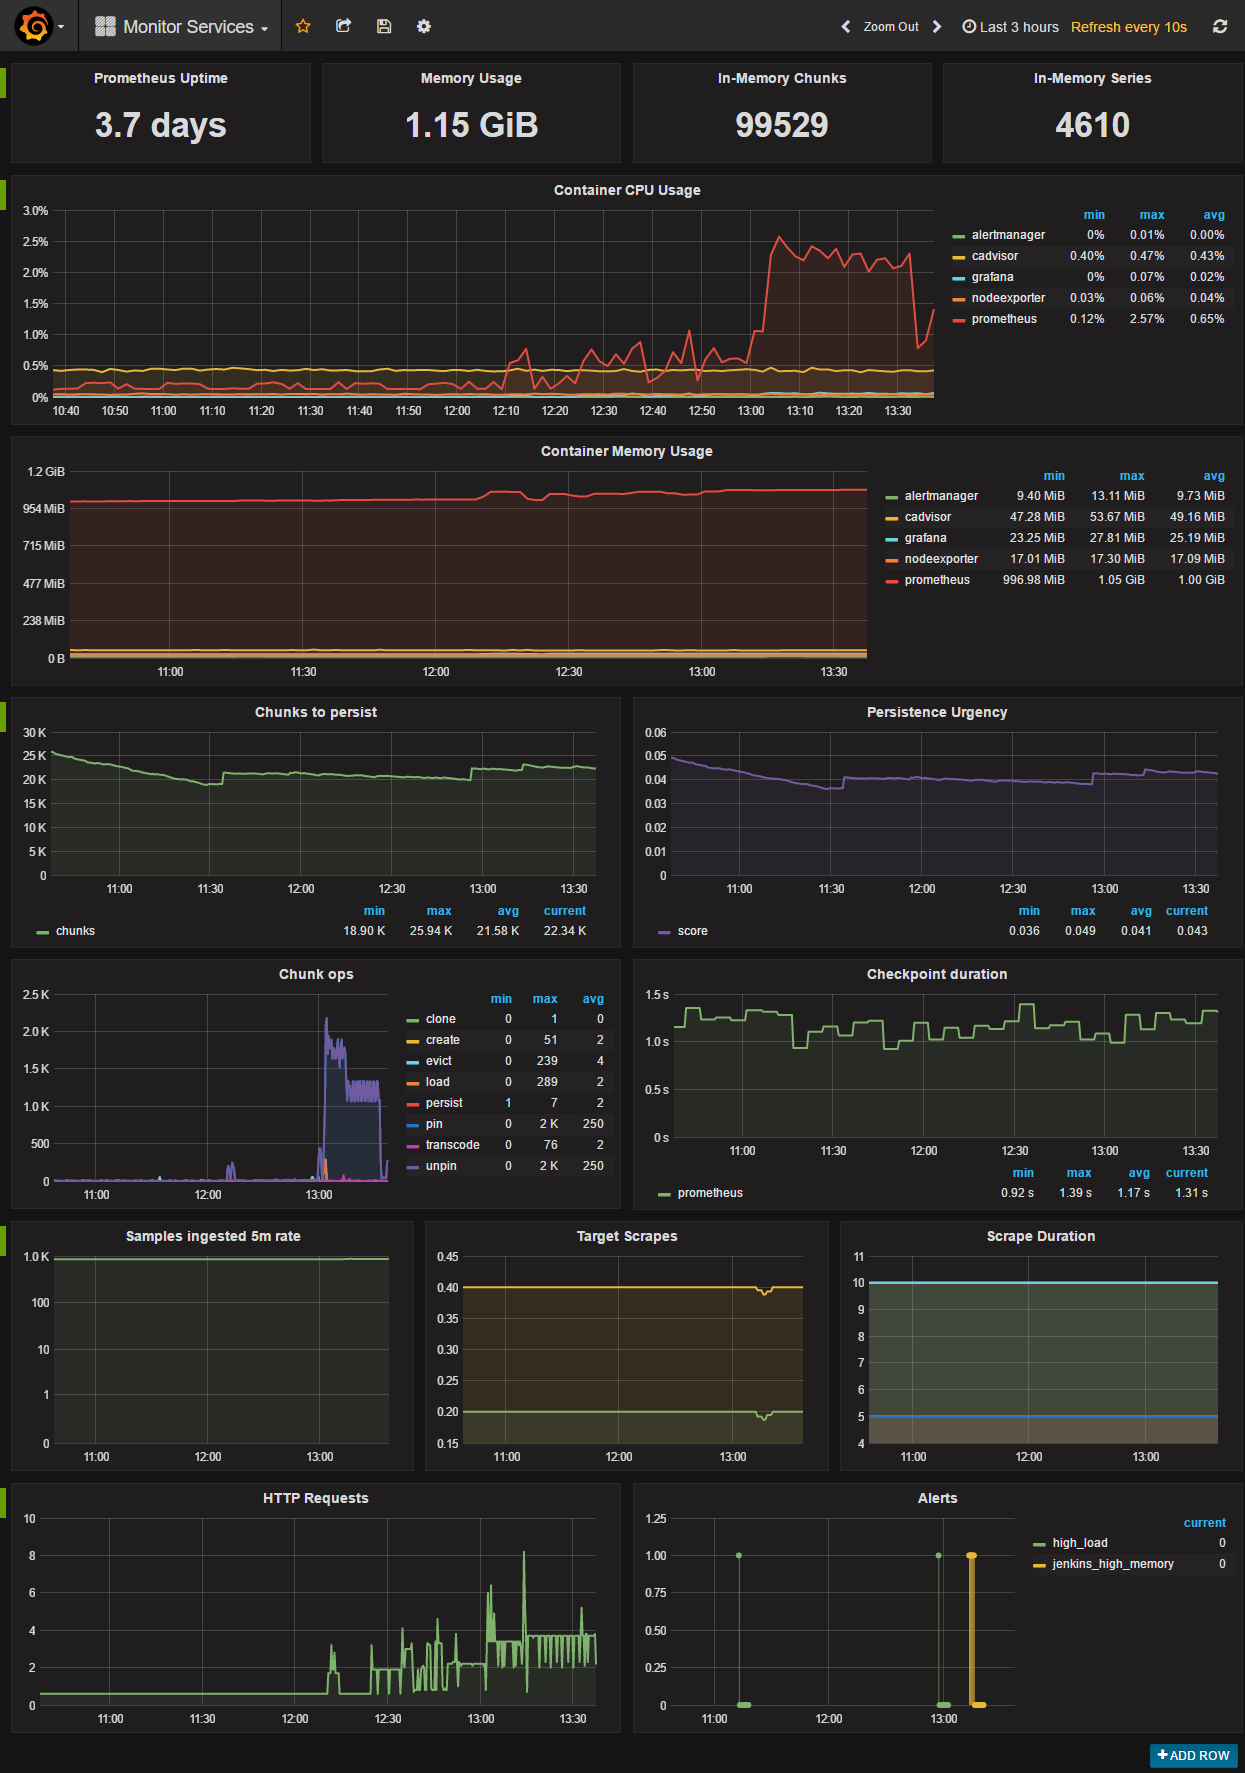
The Monitor Services Dashboard shows key metrics for monitoring the containers that make up the monitoring stack:
- Prometheus container uptime, monitoring stack total memory usage, Prometheus local storage memory chunks and series
- Container CPU usage graph
- Container memory usage graph
- Prometheus chunks to persist and persistence urgency graphs
- Prometheus chunks ops and checkpoint duration graphs
- Prometheus samples ingested rate, target scrapes and scrape duration graphs
- Prometheus HTTP requests graph
- Prometheus alerts graph
Prometheus memory usage can be controlled by adjusting the local storage memory chunks. You can modify the max chunks value in docker-compose.yml. I’ve set the storage.local.memory-chunks value to 100000, if you monitor 10 containers, then Prometheus will use around 2GB of RAM.
Part 2 will explain how to set up alerts using this stack